
Clearing, With Room to Negotiate: Santa Barbara September 2026 Market Update
More homes sold in the first nine months of 2026 than in the same stretch of any year since 2022. Buyers are paying a smaller share of asking. Which of those matters depends on where you own.
If you would move for the right property, September asked a useful question: did the market give you more room, or less?
More room to negotiate, though not more homes to choose from. Eighty-seven single-family homes and PUDs closed across the South Coast in September, against 73 a year earlier. The median sale price was $2.1 million. Sellers received 96.4 percent of their list prices in aggregate, down from 98.4 percent last September.
The market is clearing, and it is clearing with negotiation. The rest of this note shows where, and how much of the headline price decline is real.
The headline fell further than prices did
The year-to-date median sale price across the South Coast is down 11.4 percent from 2025. About half of that is a change in which homes sold, not what they sold for.
Set Montecito and Hope Ranch aside, and the year-to-date median is down 5.9 percent. The core average, which moves with every sale rather than the middle one, is down only 1.8 percent. Fewer estate closings this year pulled the headline down; the homes most households actually buy repriced modestly.
Window | All seven districts | Core (without Montecito and Hope Ranch) |
|---|---|---|
September 2026 | $2,095,000 | $1,900,000 |
July–September 2026 | $2,090,000 | $1,880,000 |
January–September 2026 | $2,115,000 | $1,900,000 |
January–September 2025 | $2,387,500 | $2,020,000 |
Year-to-date change | −11.4% | −5.9% |
Median sale price, single-family homes and PUDs. Monthly and quarterly rows pooled from individual FlexMLS closings; year-to-date rows from SBAOR monthly statistics.
Within the summer, the core held its level. Its median ran $1.85 million in July, $1.89 million in August and $1.90 million in September. Whatever changed in September, it was not the price of the middle of the market.
Where it happened
The middle of the market did the work. Homes selling between $1.5 million and $3 million carried September, and the top band thinned.
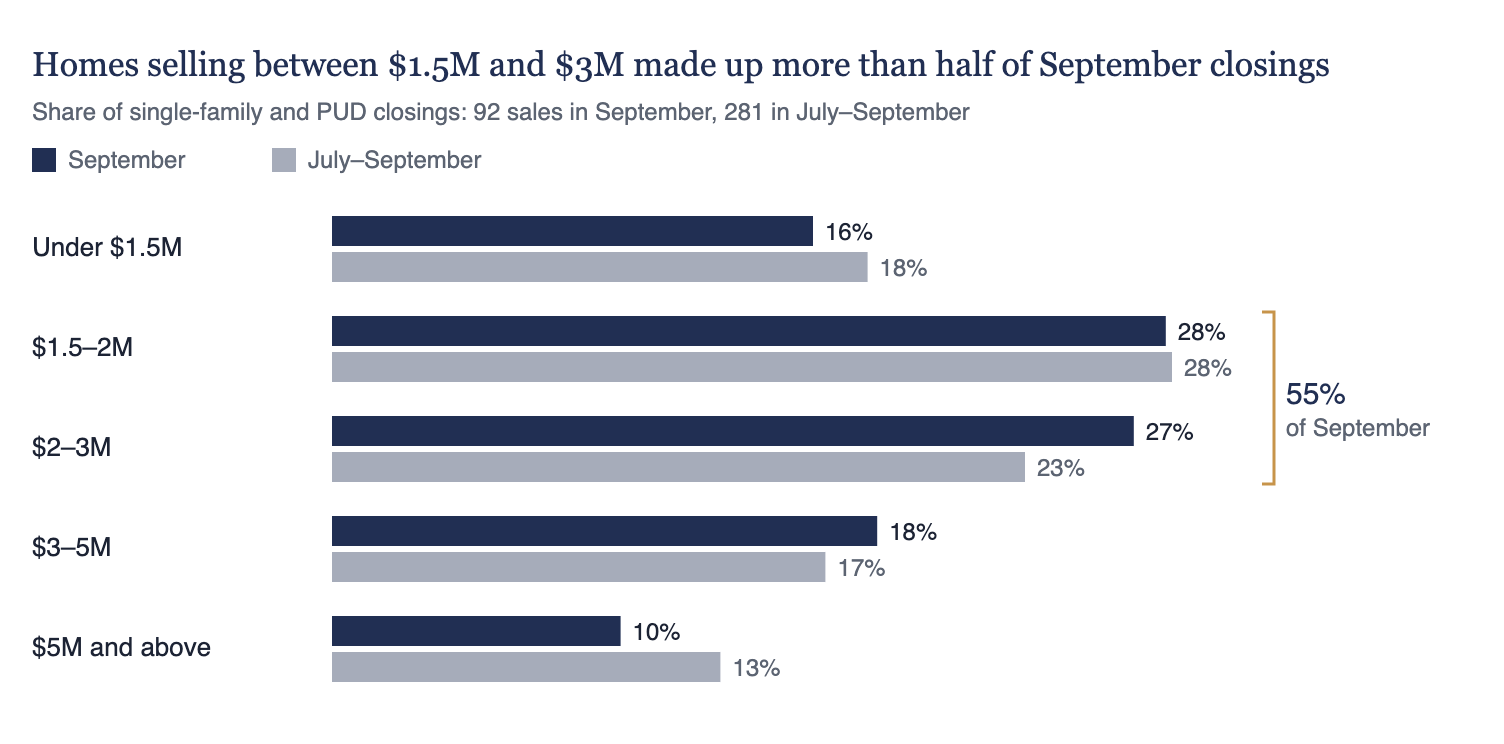
FlexMLS closings, single-family and PUD, seven South Coast districts, July–September 2026.
The thinner top band is the same shift in mix that pulled the headline median down. It says fewer estates closed, not that estates lost value.
By district, Santa Barbara is the deepest market and Goleta the fastest. Goleta homes sold in about 20 days on average over the quarter, roughly half Santa Barbara's time, and at nearly full asking price.
District | Sales, Jul–Sep | Median, Jul–Sep | Median, September | Sale-to-list, Jul–Sep |
|---|---|---|---|---|
Santa Barbara (East and West of State) | 124 | $2,052,500 | $2,066,000 | 96.3% |
90 | $1,662,500 | $1,675,000 | 99.8% | |
41 | $6,200,000 | $5,285,000 | 96.7% | |
Carpinteria–Summerland | 19 | $2,200,000 | $2,100,000 | 99.2% |
7 | $4,840,600 | No sales | 92.3% |
Hope Ranch and Carpinteria–Summerland closed too few homes to read month by month; treat their figures as directional. Montecito's monthly median moves with whichever estates close, so the quarter is the better anchor there.
The market is clearing, with more negotiation at the table
More homes sold than a year ago, about as quickly, and buyers took more off the asking price to get there.
September 2026 | September 2025 | Change | |
|---|---|---|---|
Homes sold | 87 | 73 | +19% |
New pending sales | 100 | 87 | +15% |
Average days on market | 36 | 38 | −2 days |
Cumulative days on market | 52 | 56 | −4 days |
Sale price to final list price | 96.4% | 98.4% | −2.0 points |
Sale price to original list price | 94.7% | 95.4% | −0.7 points |
Single-family homes and PUDs, Districts 05–35. SBAOR monthly MLS statistics, compiled early October each year.
The last two rows tell the more useful story. A year ago, sellers did most of their adjusting before a buyer arrived: price cuts brought list prices down, and buyers then paid close to the reduced price. This September, the gap between original and final asking prices was narrower, and more of the discount was negotiated at the table.
For a seller, the total discount from the first asking price was about the same, roughly 5 percent in both years. What changed is when it happens. For a buyer, the asking price is a more open number than it was a year ago.
Leverage moved toward buyers, from a tight starting point
September shifted the balance toward buyers month over month. Year over year, the market is still tighter than it was.
September 2026 | August 2026 | September 2025 | |
|---|---|---|---|
Active listings, early-month snapshot | 237 | 220 | 272 |
New listings | 127 | 130 | 115 |
Pending sales as a share of active | 42% | 44% | 32% |
Months of inventory | 2.7 | 2.4 | 3.7 |
Sale price to final list price | 96.4% | 97.7% | 98.4% |
Single-family homes and PUDs, Districts 05–35. SBAOR monthly MLS statistics. Months of inventory and the pending share are recomputed from the counts.
Against August, more homes are for sale and buyers paid less of the asking price. Against last September, there are fewer homes for sale and more of them are in contract. Both readings are true, and the second is the larger fact.
The listings that failed tell the same story at the top of the market. Fourteen listings expired in September at a median asking price of $4.69 million, and twenty were cancelled at a median of $2.95 million. In the same month, nine homes listed at $5 million and above closed, averaging 40 days on market. At that level, demand is present; the homes that sat were the ones priced past it.
Montecito showed the other side of that pattern. Four of its fifteen September sales closed within a day of reaching the MLS, which usually means the terms were agreed before the listing was public. In the upper tiers, a meaningful share of the market trades through relationships first.
Financing got more expensive as the month went on
The 10-year Treasury yield rose from 4.75 percent on August 31 to 5.29 percent on September 30, and mortgage rates followed.
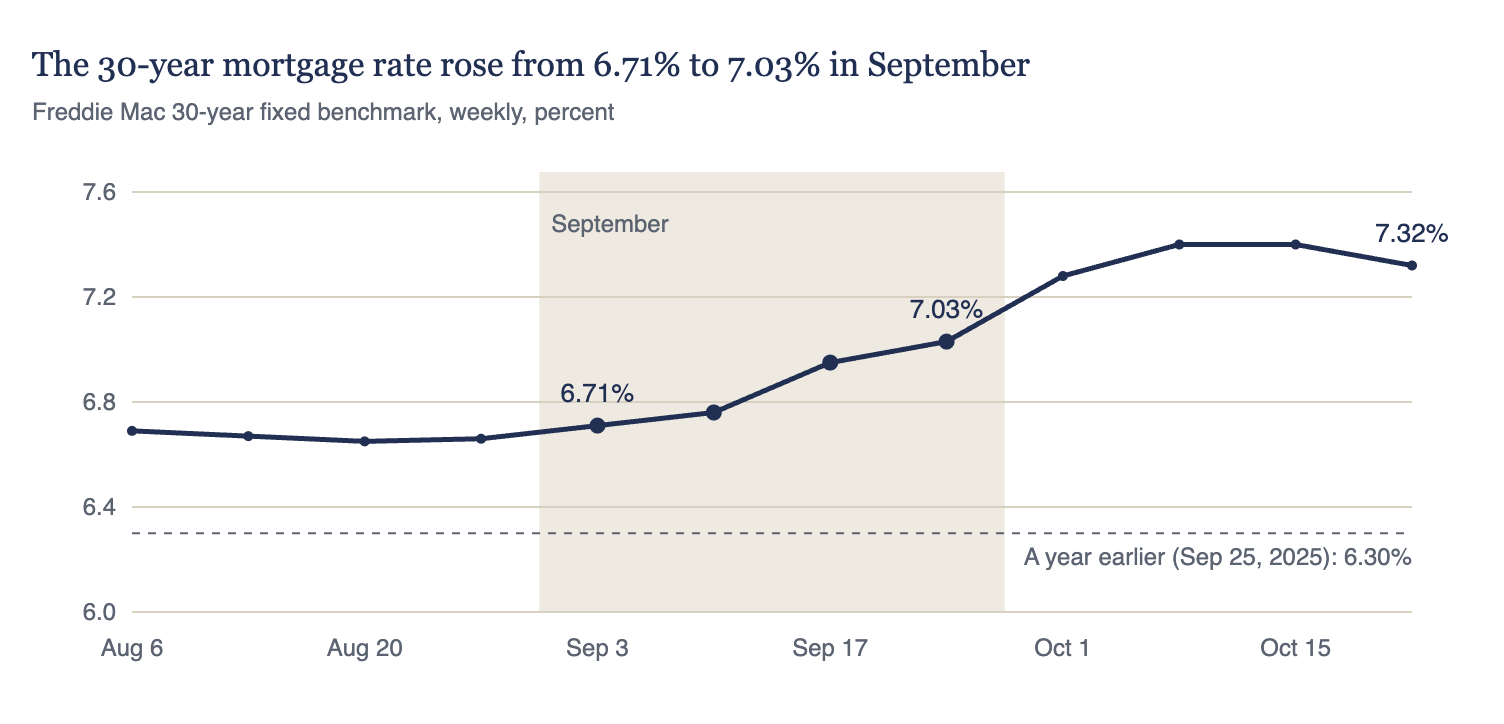
Freddie Mac Primary Mortgage Market Survey, weekly 30-year fixed average, August 6 to October 22, 2026; September 25, 2025 print for the year-earlier line.
On September's $2.1 million median, with 20 percent down, the month's move adds about $360 a month in principal and interest. Against the rate a year earlier, the difference is about $810 a month, or roughly $9,700 a year. The Freddie Mac benchmark tracks conforming loans; jumbo quotes at South Coast prices differ in level but have moved in the same direction. To run the payment at your own price and down payment, use the home affordability calculator.
The effect is uneven. Purchases where cash is common, Montecito chiefly, are the least exposed. Financed buyers in the $1.5 million to $3 million bands, where September's activity was concentrated, feel it first.
Why it matters, and what to watch
Demand is the force working for sellers. More homes sold in the first nine months of 2026 than in the same stretch of any year since 2022, and new pending sales rose 15 percent in September. Working against them are a rising cost of money and a buyer who now negotiates at the table rather than waiting for a price cut.
The risk worth watching sits at the top. Listings that expired this fall may return at new prices, adding supply in the tier that is already slowest to clear.
None of this changes the standing view. For owners who intend to stay, the South Coast remains a defensible place to hold: supply is short, and the core has repriced modestly rather than broken.
Three things will shape October's read. The first is September's contracts, which carried a median asking price of $2.65 million, well above the month's closings; if October's median rises as they close, read it against the core before calling it a recovery. The second is the rate, which reached 7.40 percent in early October. The third is whether the top-end listings that expired come back, and at what price.
What this means if your home no longer fits
If you would move for the right property, September made the buying side easier. Buyers are negotiating again, and the middle bands are still moving, so a prepared buyer has both room and a clear read on value.
The selling side asks for more discipline. The homes that sold this fall were priced to the market in front of them; at the top, the ones priced past it sat. For an owner who would buy and sell in sequence, that combination is worth thinking through before taking either step; the net proceeds calculator is a useful first pass on the sale side.
Staying is a legitimate answer too. Every season deserves a conscious choice, and for an owner without a compelling destination, a deliberate decision to stay is a good one. The useful question is the one only you can answer: what would the next home need to offer to be worth leaving this one?
If your home no longer fits but you are unsure where you would go next, call or text Alexander at (805) 568-7889. Your district's current figures are in the Santa Barbara Market Report.
Methodology
Single-family homes and PUDs in the seven South Coast MLS districts, 05 through 35; condominiums and manufactured homes are excluded. The core excludes Montecito (10) and Hope Ranch (25). Year-over-year and supply figures come from the Santa Barbara Association of REALTORS® monthly MLS statistics, compiled in early October. Monthly, quarterly and district medians are pooled from individual FlexMLS closings pulled November 4, 2026, with duplicate MLS records removed; late-reported sales make FlexMLS counts run slightly above the association's. Sale-to-list ratios are computed from total sale and list prices. Districts with only a handful of sales are directional. Payments are principal and interest on a 30-year fixed loan with 20 percent down, before taxes and insurance.
General market orientation, not advice on a specific property.
Sources: Freddie Mac Primary Mortgage Market Survey · U.S. Treasury daily par yield curve rates · SBAOR monthly MLS statistics, September 2025 and September 2026 · FlexMLS
Alexander Stoeber · Compass · DRE #02090649