
Montecito vs Hope Ranch: Two Enclaves, Opposite Years
Montecito and Hope Ranch sit a few miles apart and get quoted as one idea: the top of the South Coast. This year they stopped agreeing.
Hope Ranch sold more homes than last year, at a higher median, with almost no distance between its average and its middle. Montecito sold nearly a third fewer, its median fell, and its average set a high. Two adjacent enclaves, the same five months, opposite readings on every line.
The instinct is to fold them back into a single sentence about the top of the market. Resist it. The aggregate is not a market here — it is the average of two markets moving apart. The work is knowing which one you are standing in, and, if you are buying, which one is quietly handing you leverage.
I · Value
The split
Start with what the numbers say plainly. Montecito closed 63 single-family homes through May against 89 a year earlier — down 29 percent. Its median fell 7 percent to $5.58 million. Its average rose 16 percent, to a high of $8.33 million. Hope Ranch went the other way on all three: 17 sales against 14, a median up 11 percent to $7.55 million, an average essentially flat.
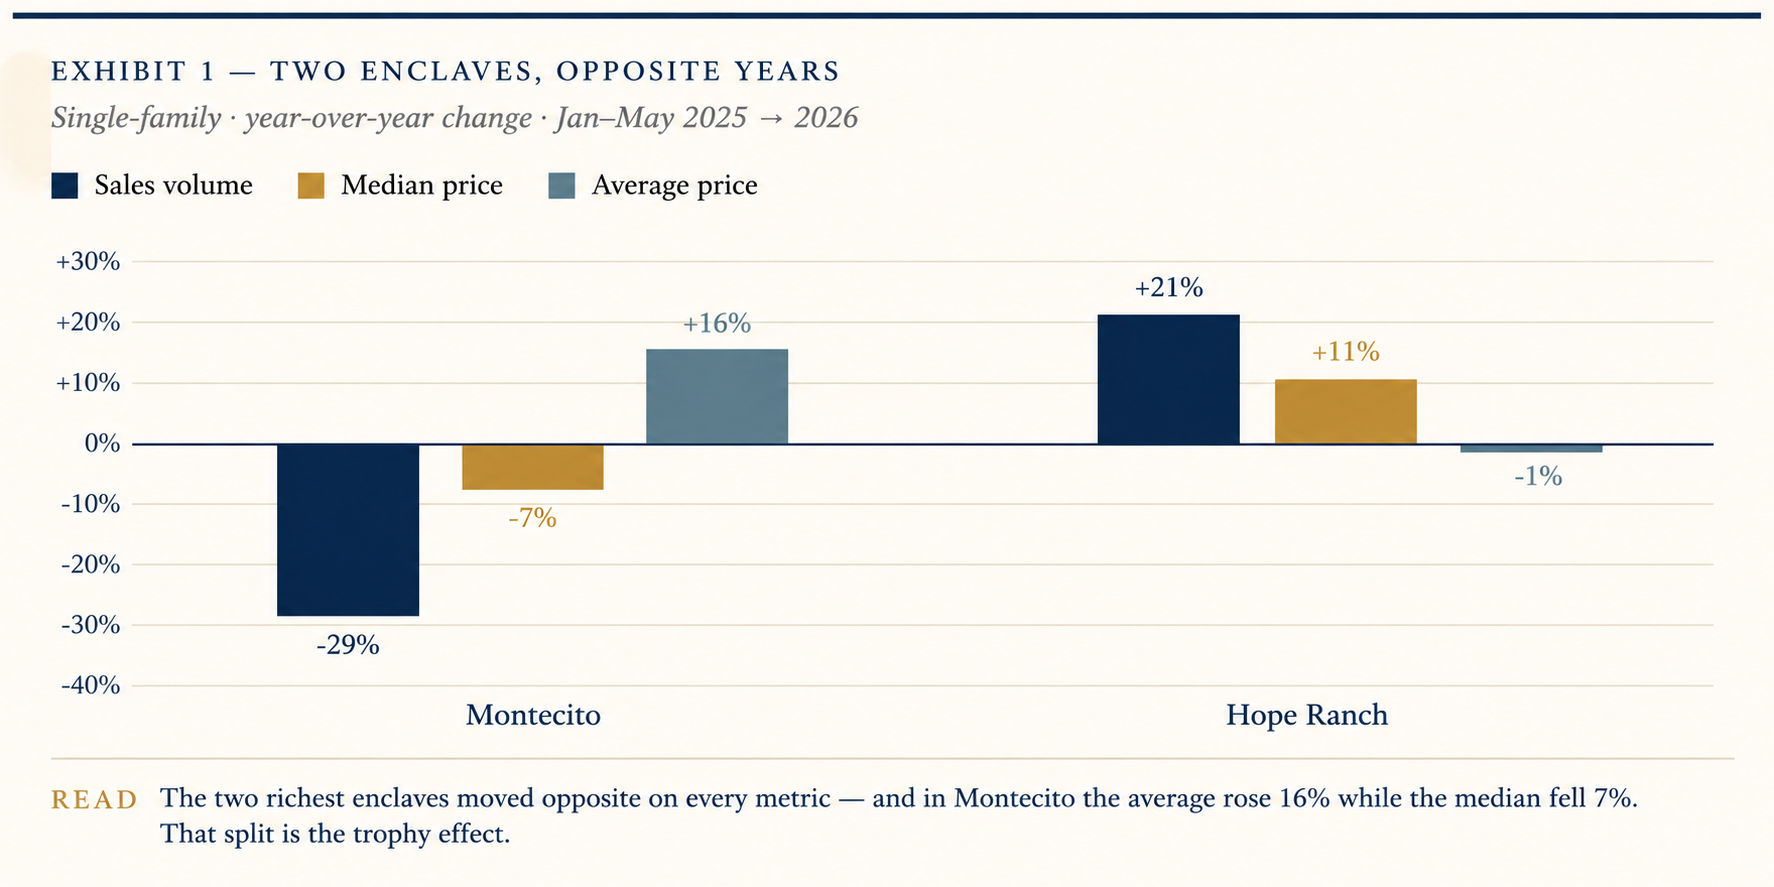
The two enclaves move opposite. And inside Montecito, the average and the median moved opposite each other — one climbed while the other fell. A market cannot lose value and set a price record in the same breath. What it can do is change which homes are trading. That is the whole story, and the next four exhibits take it apart.
II · Value
The trophies, and the middle
The distance between an average and a median measures how lopsided the sales are. Over a decade, Montecito's two lines climbed together. This year the gap between them is the widest it has ever been — $2.76 million.
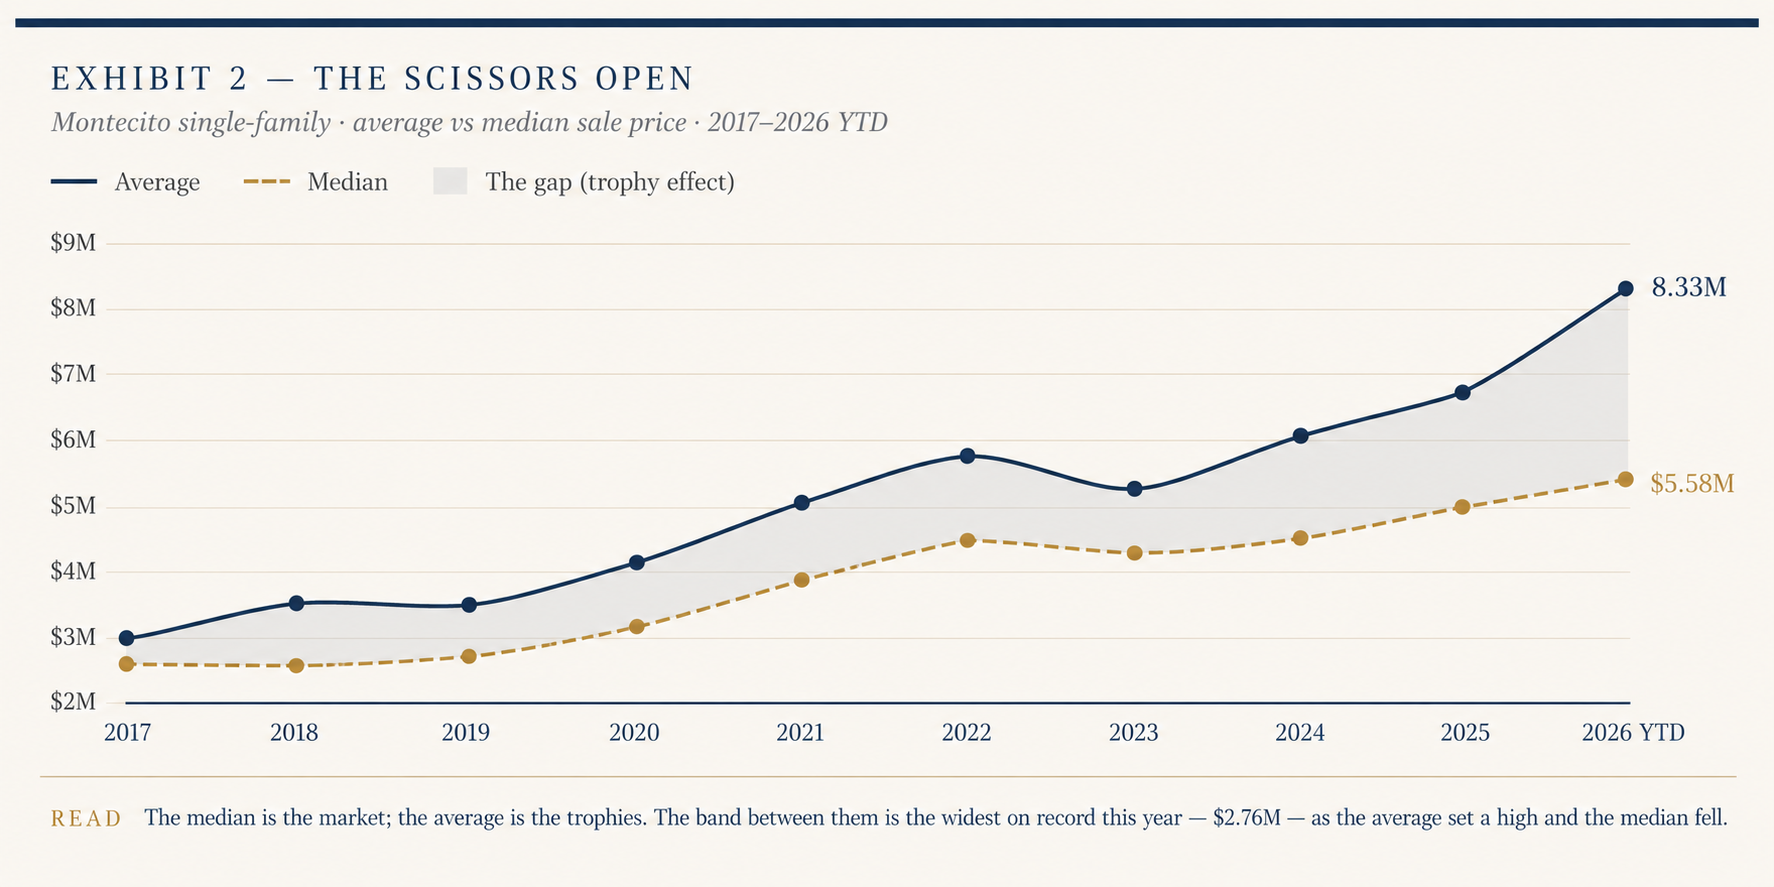
The average is carried by a handful of very large closings. Roughly a quarter of Montecito's sales this year cleared above ten million dollars, and nearly two in five cleared above six. Set that concentration against a thinning middle and the average rises while the median falls — no single home has to lose a dollar for both numbers to tell that story. The median is the home a typical buyer actually transacts. The average is the top of the market deciding the headline. When someone tells you Montecito is up, the useful question is which number they mean.
III · Position
Which median you can trust
There is a way to measure how far a median has drifted from reliable: divide the average by it. At 1.0 the two are equal and the median describes the market exactly. Past roughly 1.55, the high end is doing so much of the talking that the median stops being a safe headline.
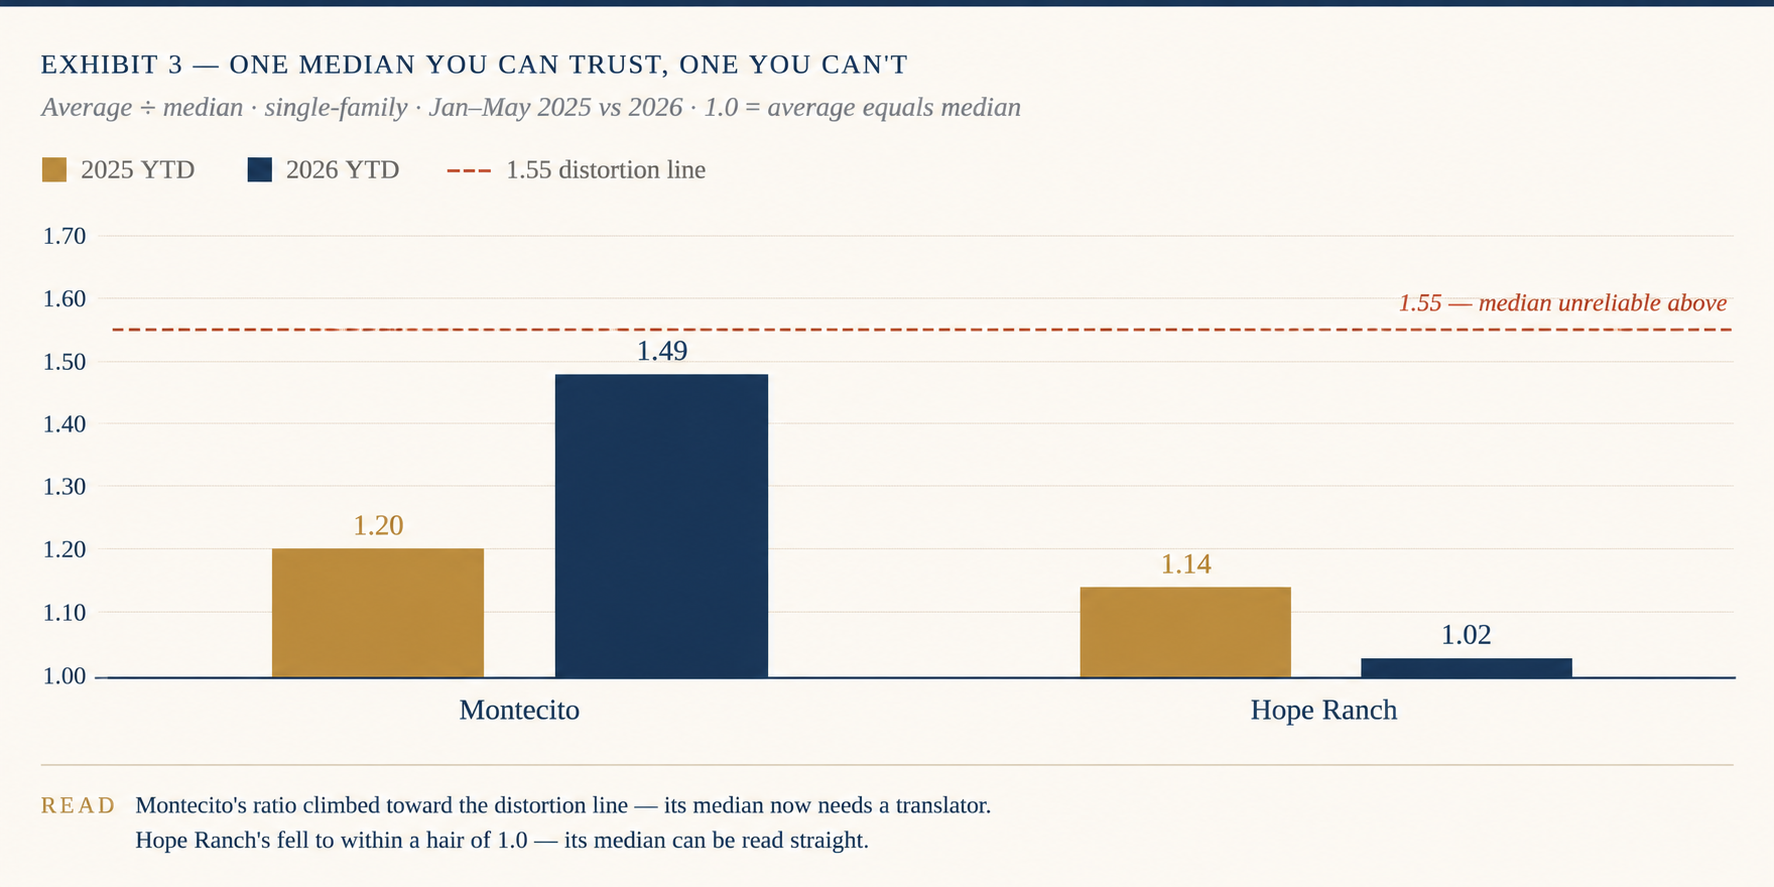
Montecito's ratio climbed from 1.20 to 1.49 in a single year, within reach of the line. Hope Ranch's fell from 1.14 to 1.02, a hair above perfect. One enclave's median now needs a translator; the other's can be read straight.
That produces an inversion worth naming. On the year-to-date numbers, the typical Hope Ranch home cleared higher than the typical Montecito home — $7.55 million against $5.58 million — a reversal of the usual order. Read it carefully. That is a statement about which seventeen Hope Ranch homes happened to trade, not a claim that the enclave repriced above its neighbor. The clean ratio is what tells you the figure is solid; the small count is what tells you to hold it loosely.
IV · Forces
The cause was a freeze
Prices at the top held for a reason that has nothing to do with demand surging. Supply stopped.
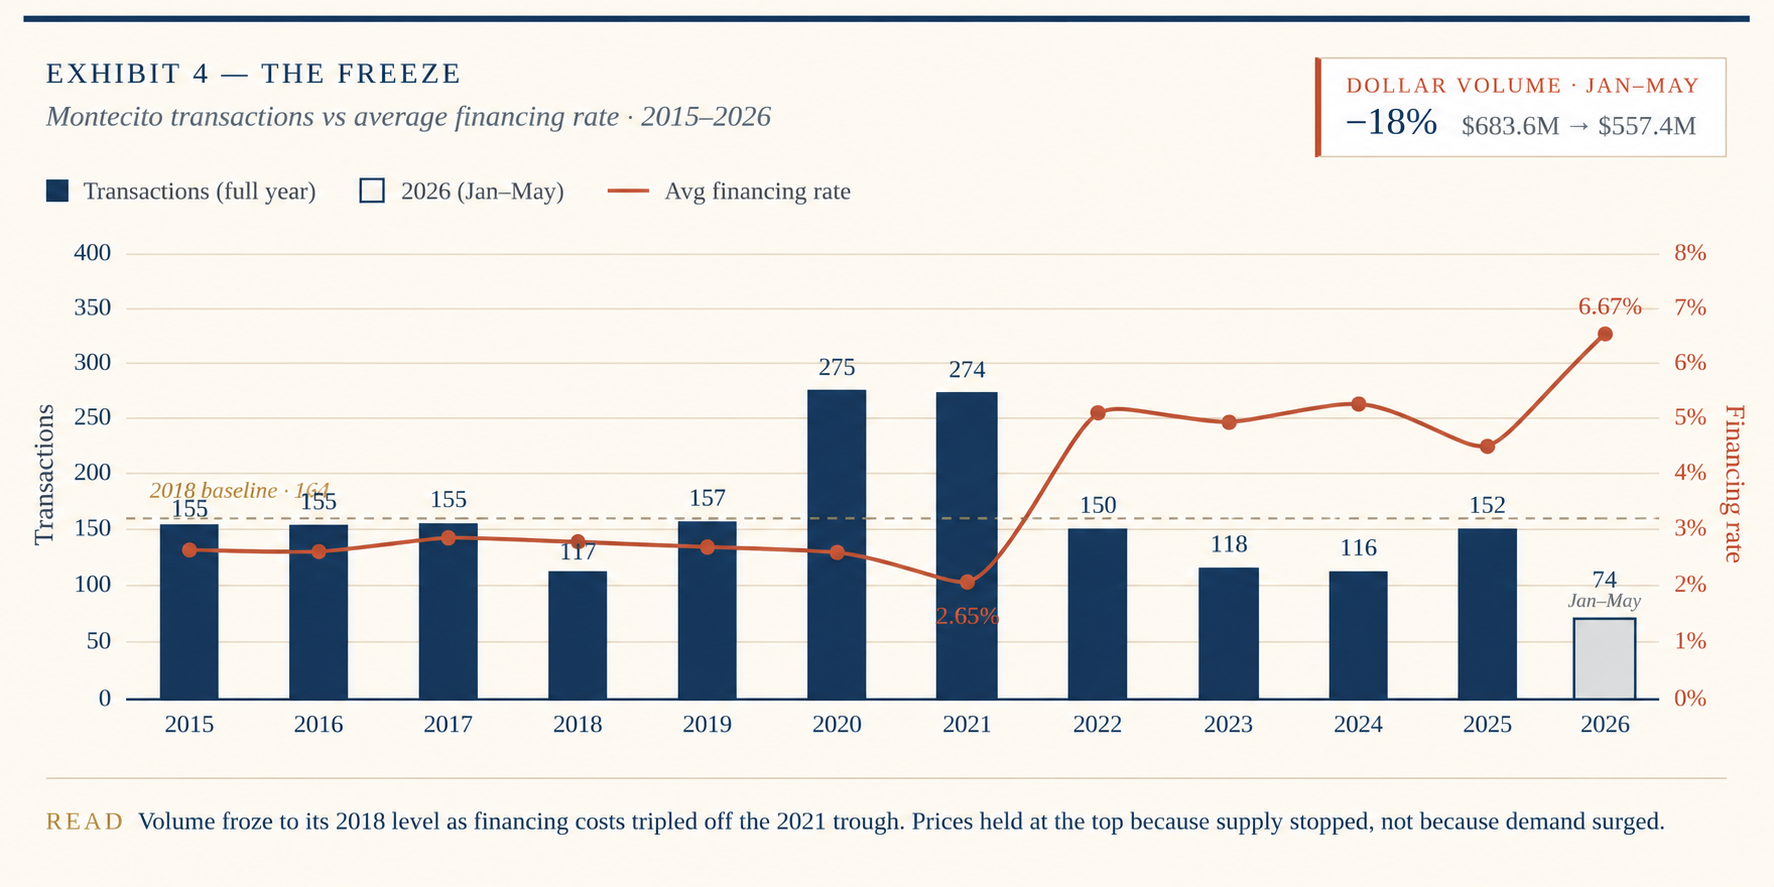
Montecito closed about 163 homes in 2024 and 167 in 2023 — the same volume it cleared in 2018, and less than half its 2020–21 peak. The variable that changed is the cost of money. Financing ran near 2.65 percent at the 2021 peak and rose past seven before easing to the mid-sixes. Owners who do not have to sell, do not. The trades that still clear are the discretionary ones — cash-heavy, clearing near ask — which is why the average stayed rich while the count collapsed. Dollar volume tells the truer story: down 18 percent year-to-date even with a record average price, because far fewer dollars changed hands on far fewer homes. A frozen market can post a high average. That is not the same as a strong one.
V · Position
The thaw, and where leverage returns
A freeze leaves a mark, and the mark is time. Montecito homes are taking roughly twice as long to sell as they did at the 2023 trough — 96 days against 49.
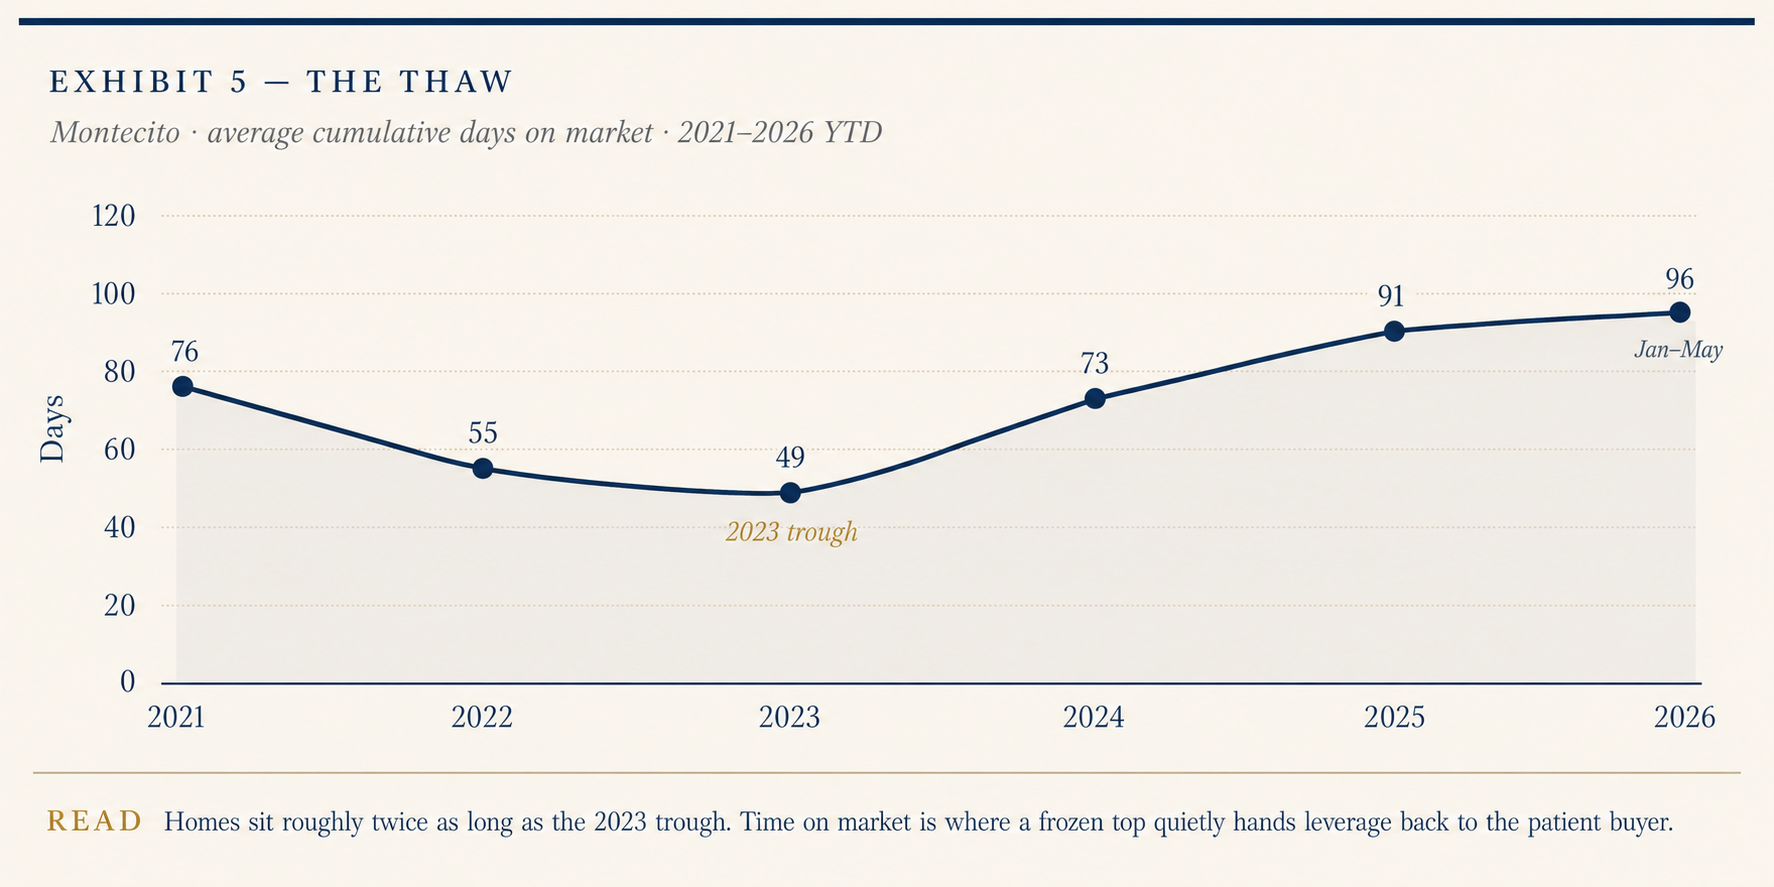
The blended sold-to-list ratio still reads 96 percent, which sounds firm until you remember it is an average. The fresh, well-priced listing clears near ask and pulls that number up; the home that has sat four months is where the negotiation actually lives. Lengthening time on market is the first thing that moves when a seller's market loosens, and it is moving. Patience is turning back into leverage.
VI · Position
Where the opportunity sits
This is where the two markets stop being a curiosity and start being a map.
The softness in Montecito is not at the top. The ten-million-and-up tier set the average and clears competitively, often in cash. The give is in the middle — the two-to-six-million band that held about sixty percent of this year's trades and where the median fell. The negotiating room is in the band the headline ignores, not the one it celebrates.
Hope Ranch plays the other role. Its firm, undistorted median and rising volume make it the more legible exit — the place a finished home meets clean demand. A buyer's edge in this market is structural: fewer financed competitors at six and seven percent, more weight behind cash, more aged inventory to work, and a clearer read on where value resells.
None of that is a forecast, and none of it is advice about a specific house. Public numbers can tell you which market you are standing in. What they cannot do is price the parcel in front of you — the condition, the micro-location, the carrying cost, and increasingly the question of what stays insurable as the decade runs. That work is specific, and it begins privately.
See for yourself
Montecito Active Listings
See for yourself