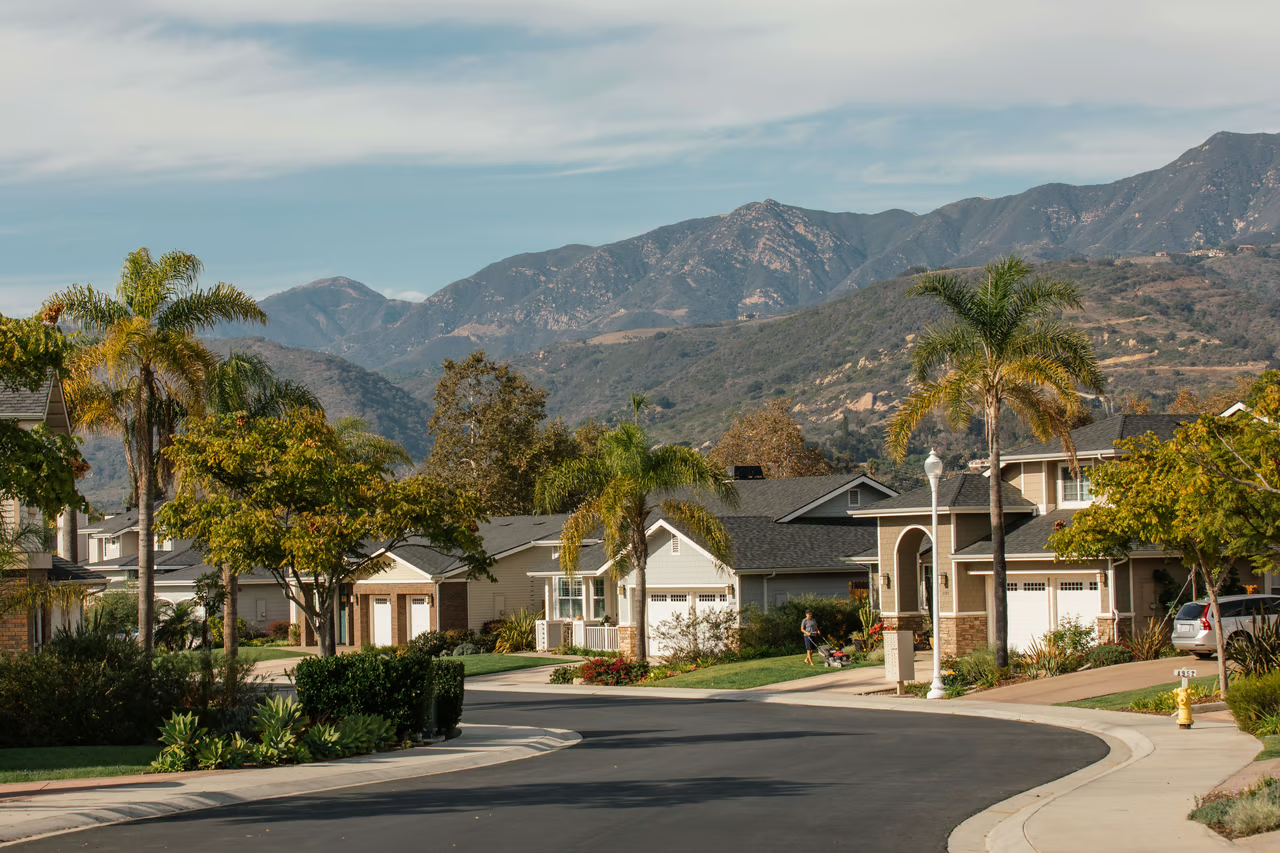
Santa Barbara Neighborhoods
Santa Barbara is not one real estate market. It's at least five — and the difference between them changes every decision.
How do Santa Barbara's neighborhoods actually differ?
They differ more than in almost any other place of comparable size.
In a single month, the median home in Goleta and the median home in Montecito can sit millions of dollars apart —
and they don't just differ in price, they clear at different speeds, respond differently to interest rates, and reward completely different strategies.
Across South Santa Barbara County in May 2026, there were 93 closed sales at a median of $2,325,000, but that single number hides a range that runs from roughly $1,530,750 in Goleta to well above $5,600,000 in Montecito and Hope Ranch.
That's why the most useful question isn't "what's the Santa Barbara market doing?"
It's "which of these markets am I actually in."
Read the system first — then read the parcel.
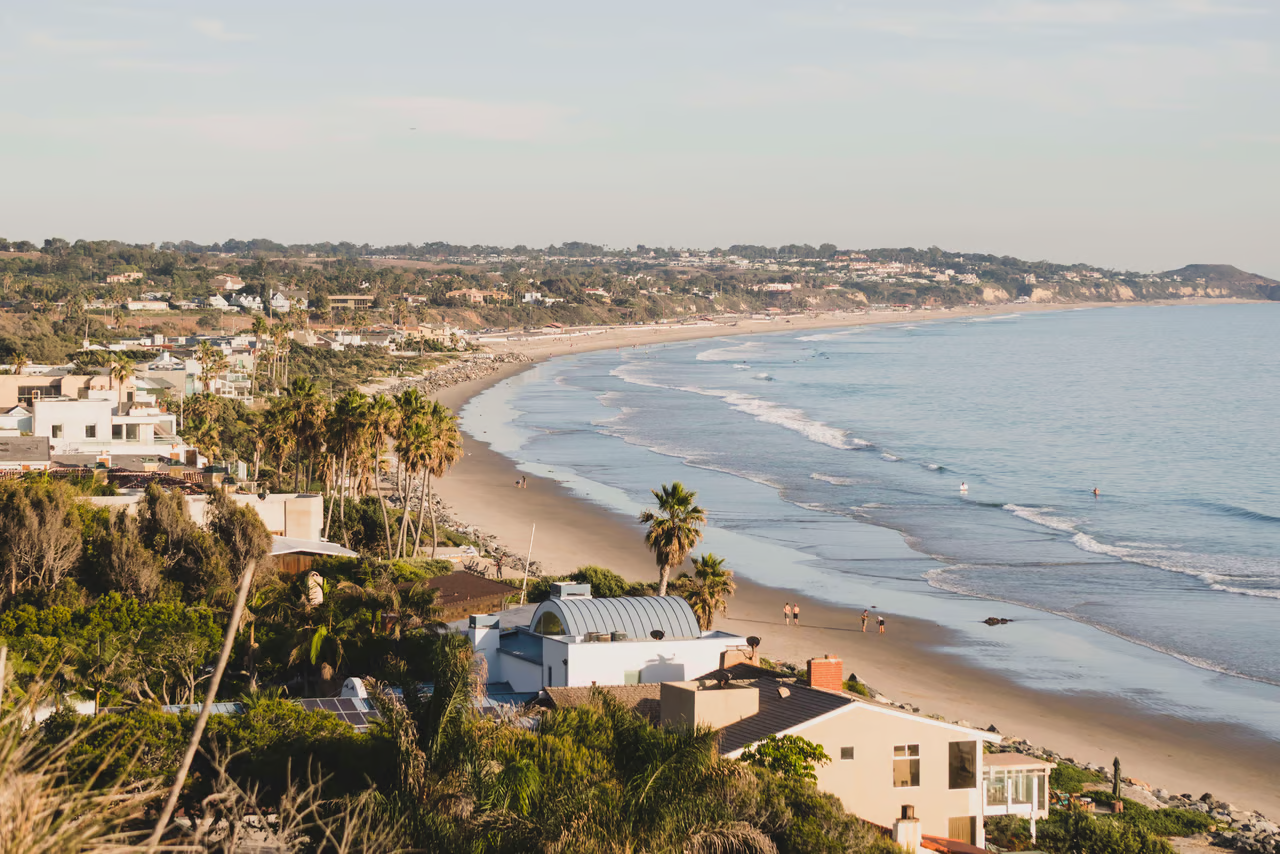
The South Coast markets, side by side
Current figures, updated monthly. Each area links to its full market read.
The same county, the same month — a spread of millions between the typical home in one area and another. *Thin markets are shown on a trailing-twelve-month basis; monthly sales are too few to read reliably.
| Area | Median sold | Sales | What defines it |
|---|---|---|---|
| Goleta → | $1,530,750 | 31 | Fastest clearing The most payment-driven market — the South Coast's release valve. |
| Carpinteria → | $1,500,000 | 15 | Tightening Coastal, smaller, and competitive at the entry to the market. |
| Santa Barbara → | $1,850,000 | 68 | The broad middle The largest market by volume, spanning the widest range of homes. |
| Summerland → | $3,900,000* | 1 | Very small market So few sales that it's only honest to read it over time, not by the month. |
| Montecito → | $5,600,000 | 17 | Cash-driven Prone to headline distortion: a few large estate sales pull every average upward. |
| Hope Ranch → | $7,140,000* | 2 | Slowest clearing The upper band — high inventory, few sales, the longest time to clear. |
Medians from monthly county sales data. *Thin markets shown on a trailing-twelve-month basis. Figures for May 2026, last updated 2026-05-31.
Explore each market
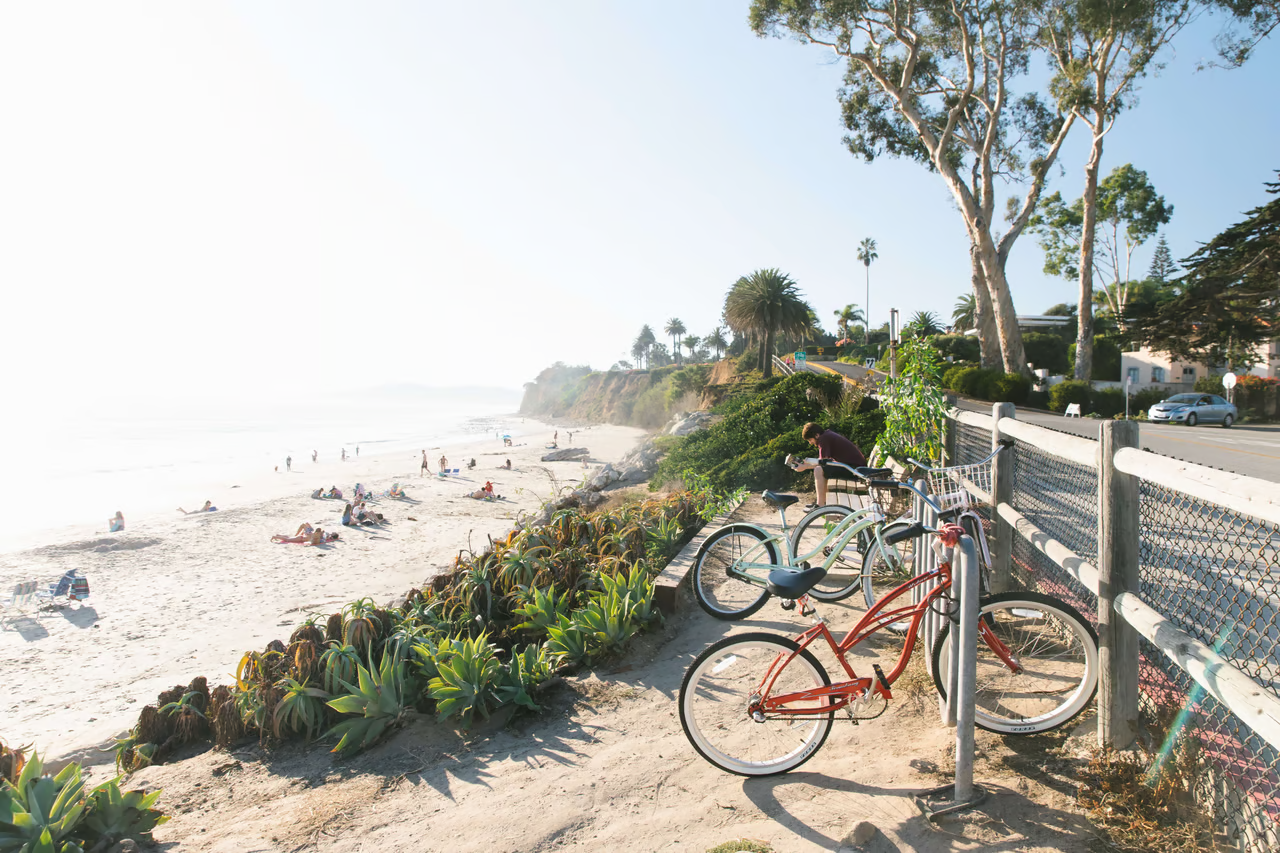
Six markets, one coast

Start Your Property Search
Work With Alexander
Ready to understand your next move?
Request a private consultation with Alexander Stoeber to discuss the market, the property, and the decision in front of you.
COMPASS
Alexander Stoeber is a Santa Barbara real estate advisor with Compass, helping owners and buyers understand the market, the parcel, and the decision before they move.
Address
801 Chapala St, Santa Barbara, CA 93101
Alexander Stoeber
(805) 568-7889
Subscribe to Our Newsletter
Let's Connect

Experience Life By Design
Copyright ©2024|Privacy Policy
Real Estate Website Design by Luxury Presence
All information is deemed reliable but not guaranteed and should be independently reviewed and verified.
