

The Median Is Not the Market: How to Read Santa Barbara Price Data
Santa Barbara County's median sale price is a real number that measures something other than what most readers think it measures. Here is what it actually tracks, and what to read instead.
The county median is not a flawed statistic. It is a correctly computed statistic answering a question almost nobody is asking.
Every month it arrives in the paper, in portal emails, in the note a client's advisor forwards with a one-line comment attached. It moves five percent, or eleven, or thirty. Owners read it as a verdict on what they own. Buyers read it as a signal about when to move. Both readings assume the number is describing what happened to property values in Santa Barbara. It is describing something else entirely: the midpoint of whatever happened to sell.
Those are not the same thing, and in this county they are barely related. That is the belief this piece installs, and it is the foundation everything else in this publication rests on. Once you can see the difference, most local market commentary reorganizes itself in front of you — and a number that used to feel like a judgment starts to look like what it is, which is a measurement of composition wearing the costume of a measurement of value.
What a median actually measures
Start with the calculation, because the whole argument follows from it, and none of it is controversial. Line up every sale in a period from cheapest to most expensive. The median is the one in the middle. That's it. It contains no information about whether any individual home became more or less valuable — it reports only which home landed in the middle of the list. Change which homes are on the list, and the middle moves. No property anywhere has to reprice for the median to post a double-digit change.
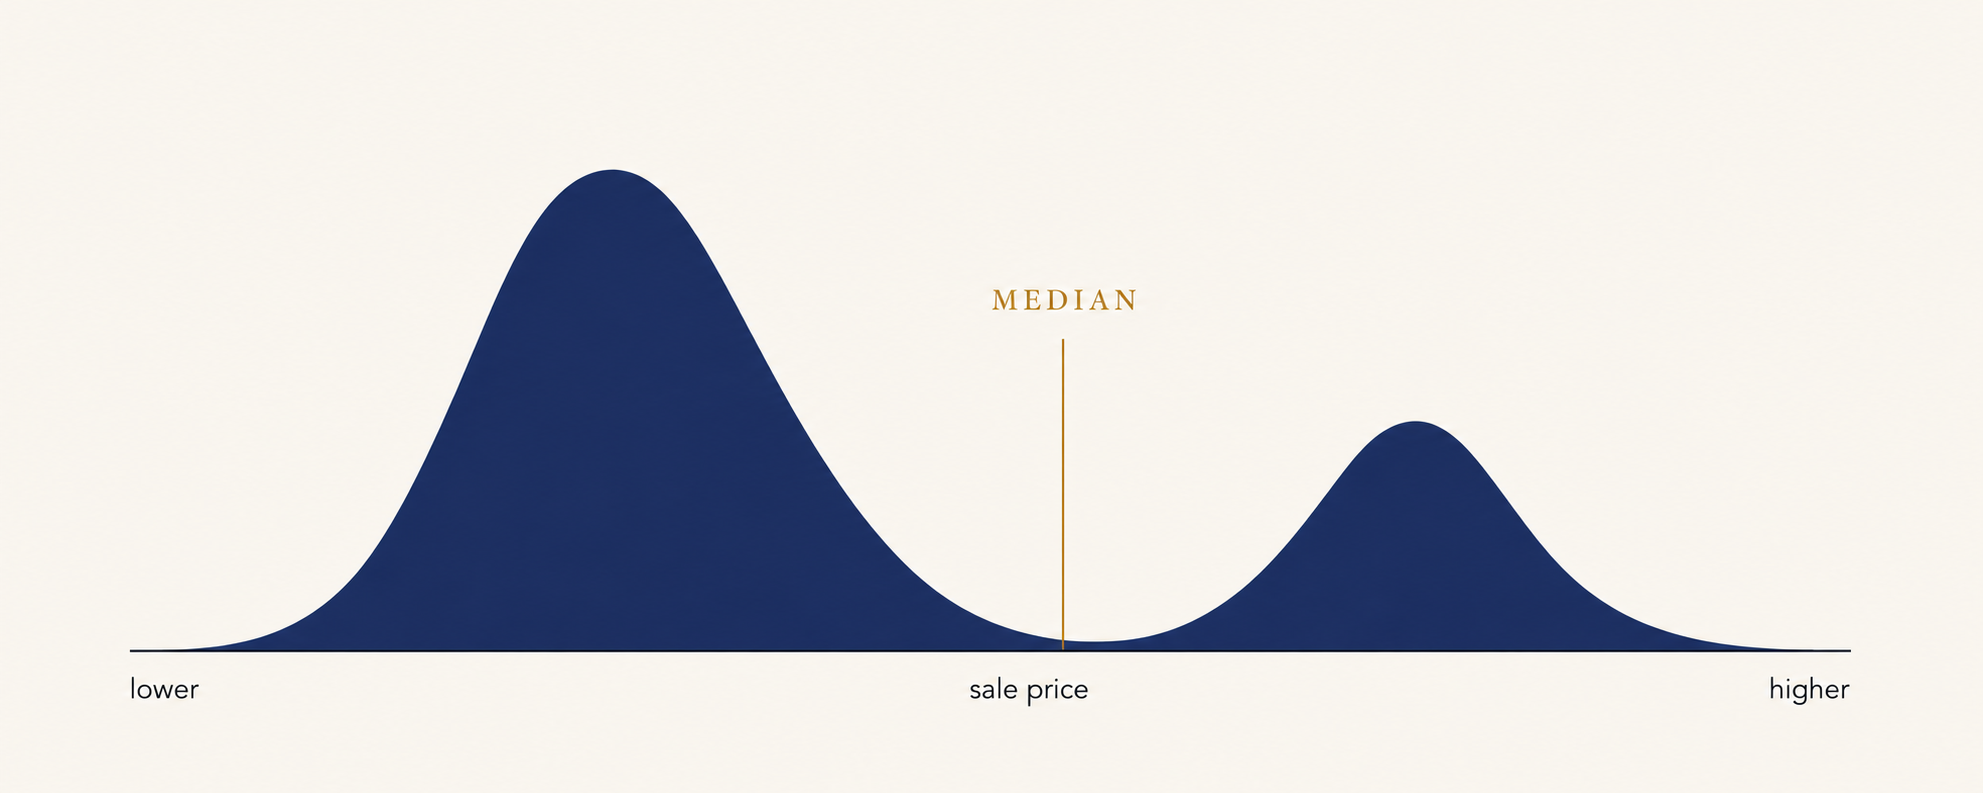
In most markets this doesn't matter much, because most markets are reasonably uniform. A median works well when the thing you're measuring has one center of gravity. Santa Barbara County has at least two, and that is where the trouble begins.
The first distortion: north and south
The county contains two housing economies that share a name and very little else. Homes in the north county trade at a fraction of South Coast prices, in volume, and the two markets respond to different employers, different buyers, and different constraints. A month in which a few more South Coast sales close than usual — or a few fewer — produces a county-level "move" manufactured entirely out of geography.
This is not a contrarian local reading. The state association's own economists have publicly cautioned that computing a countywide median for Santa Barbara is methodologically unsound, precisely because of the north–south divergence, and have described a reported double-digit county increase that dissolved on inspection into nothing more than a shift in which end of the county happened to transact that month.
When the organization that collects the data tells you the county figure is the wrong instrument for this county, the burden of proof has moved.
The second distortion: the enclaves
Most readers never reach this one, because the obvious correction — just look at the South Coast — feels like it should be sufficient. It isn't, because the South Coast contains the same problem in miniature.
Montecito and Hope Ranch transact at multiples of everything around them, on small counts. Ten Montecito closings in a month carry more weight on the South Coast midpoint than several hundred sales everywhere else combined. Their presence or absence in a given month is close to random — a function of when a handful of estates happen to close escrow — and yet it moves the number that gets reported as the market.
Which is why the honest read strips them out. The Core median is the same market with Montecito and Hope Ranch removed: Santa Barbara proper, Goleta, Carpinteria, Summerland. It is not a proprietary construction — it appears directly in the association's own monthly reporting — and it is the number that behaves like a market rather than like a lottery.
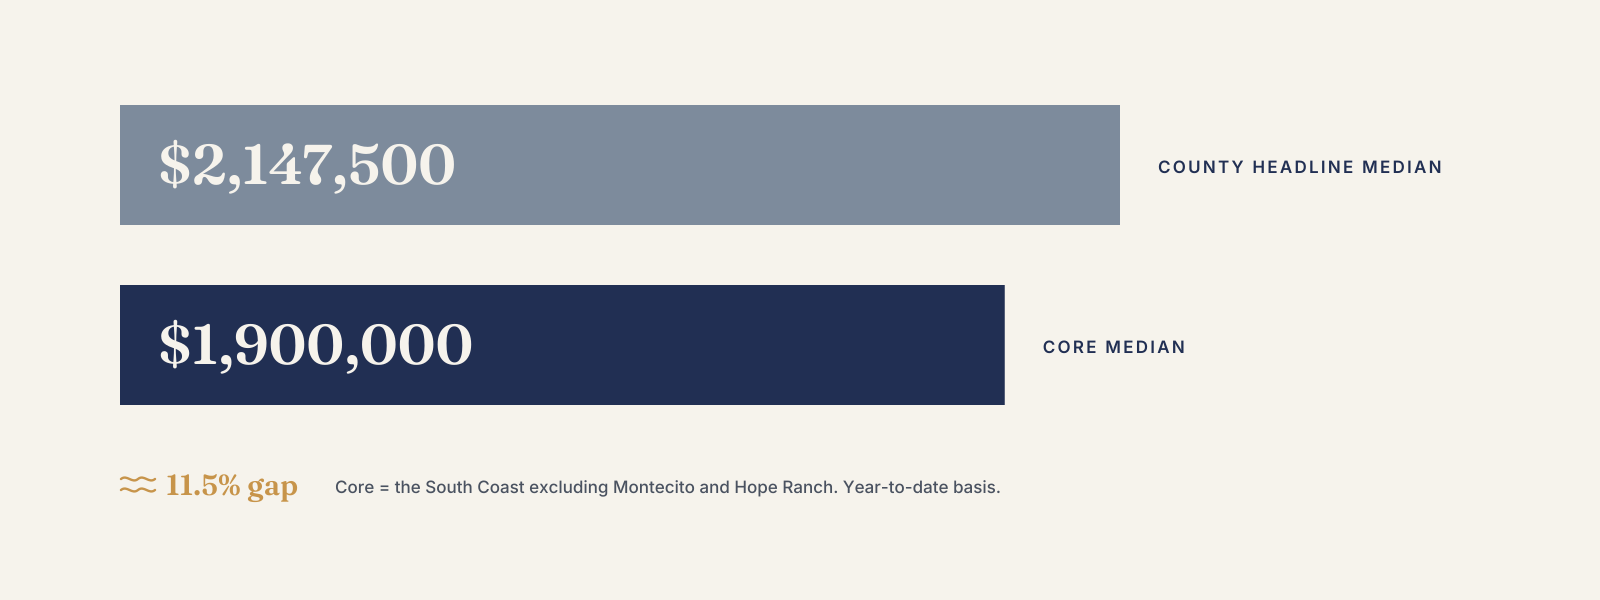
The gap between the two is worth seeing plainly. Through June 2026, the county headline median stands at $2,147,500. The Core median stands at $1,900,000. That difference, roughly eleven and a half percent on a year-to-date basis, is not a discount or an adjustment. It is the distance between the number that gets reported and the market most people are actually in.
The same headline, twice, for opposite reasons
A skeptical reader can accept everything above and still assume the distortion is stable — that you could simply subtract eleven percent and get on with your life. This year proved otherwise, twice, in opposite directions.
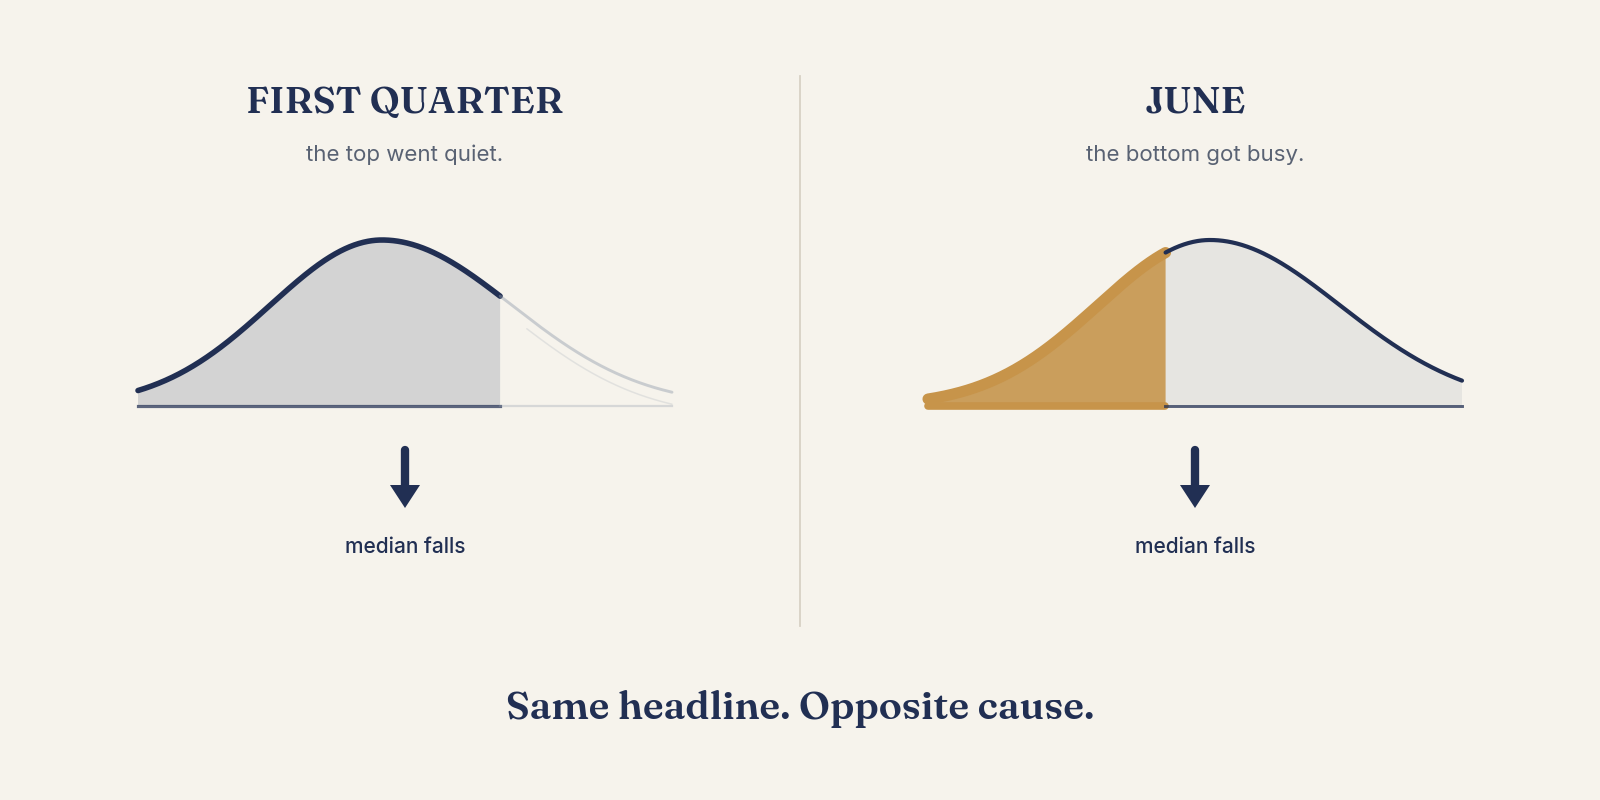
In the first quarter, the county median fell. The cause was the top going quiet: fewer of the very large sales that normally lift the midpoint, so the midpoint dropped. In June, the county median fell again, by 11.3 percent — and this time the top end posted its heaviest closings of the year. The median fell because the bottom got busy. The share of closings under $1.5 million went from 13 percent in May to 25 percent in June, and that single shift dragged the midpoint down while the average price rose 9.6 percent in the same month.
Two falling medians. One caused by strength leaving the top, one caused by volume arriving at the bottom. A reader watching only the headline would have experienced them as the same event, and would have drawn the same conclusion from both. The conclusions should have been opposite.
That is the real lesson, and it is more demanding than "the median is unreliable." Mix distortion has a direction. Correcting for it requires knowing which way it ran this time, which requires looking at the distribution rather than the summary. There is no fixed adjustment. There is only the work.
The small-sample trap
One more failure mode belongs here, because it catches people inside their own neighborhoods rather than at the county level. Small samples produce large percentages. A district with nine sales can post a sixty percent "increase" that describes nine houses and nothing else.
A market with two sales has a midpoint, not a median — Hope Ranch closed two homes in June, roughly twelve million dollars apart, and the middle of two unlike things is an arithmetic fact rather than a market signal. Thin markets are read over time or not at all, and any figure built on a handful of transactions should be treated as an anecdote that happens to have a decimal point.
How to read any Santa Barbara price figure
Here is the discipline, and it takes about thirty seconds once it's habit.
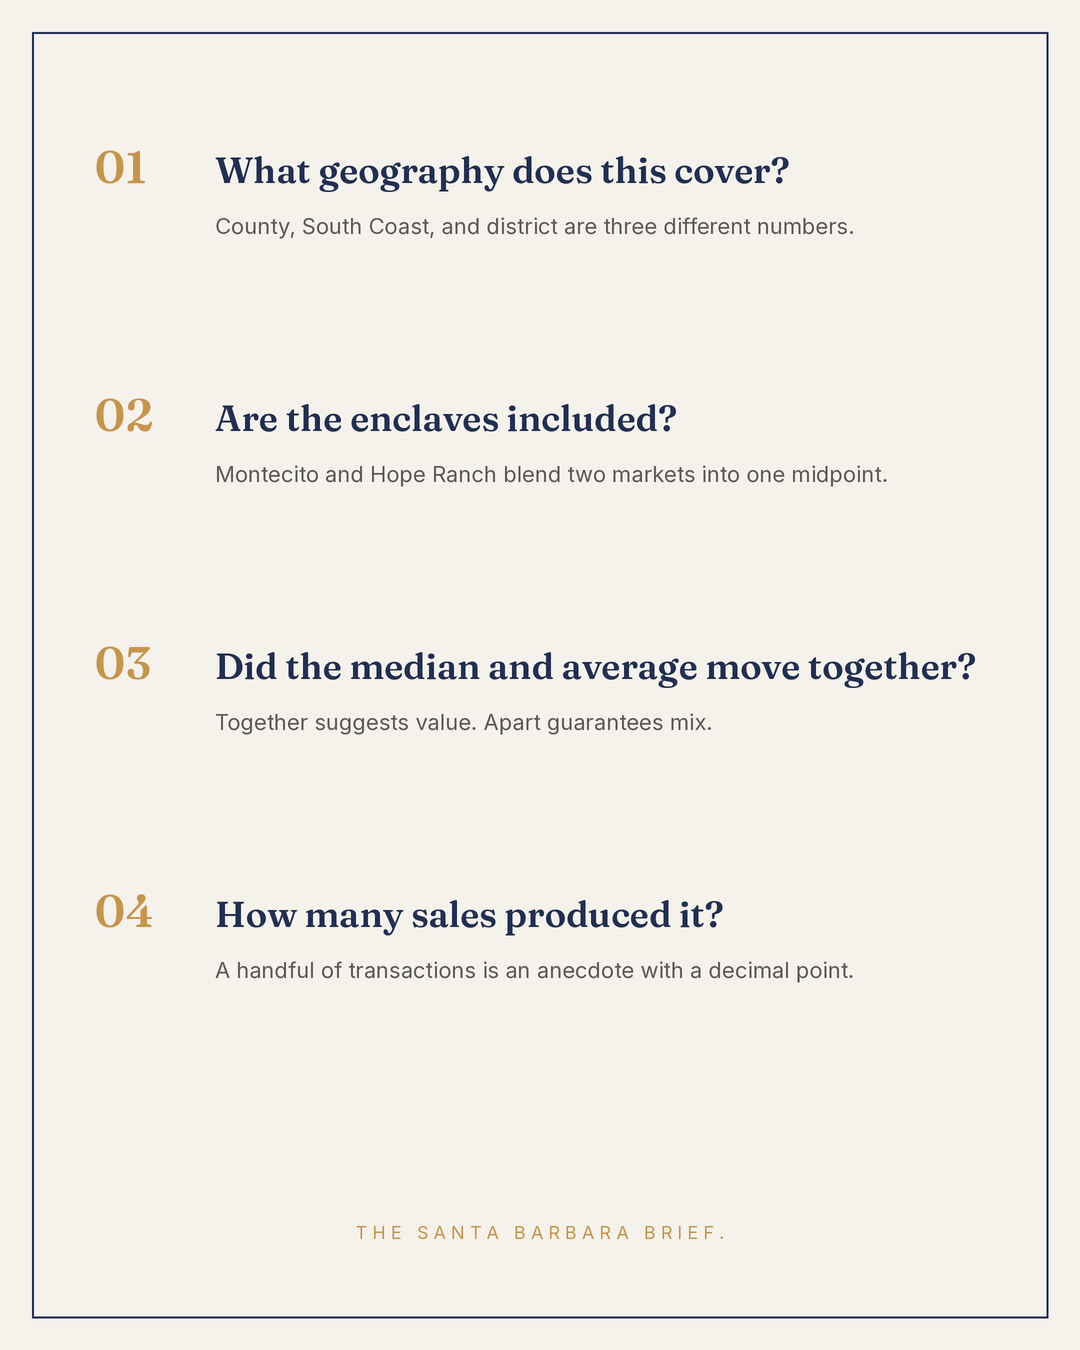
Ask first what geography the number covers. County, South Coast, or district are three different numbers routinely reported under the same three words, and the difference between them is larger than most of the movements being reported.
Ask second whether the enclaves are inside it. If Montecito and Hope Ranch are included, you are reading a blended figure whose midpoint belongs to neither the enclaves nor the market underneath them.
Ask third whether the median and the average moved together. Together suggests something happened to value. Apart guarantees something happened to the mix — and tells you to go find out which end of the market moved.
Ask fourth how many sales produced it. Below a handful, the percentage is noise dressed as signal.
Four questions, and they resolve most of what passes for market news here.
What the county median is actually for
None of this means the county median should be abolished. It answers its own question perfectly well: what did the middle of everything that sold in this county cost this month? That is a legitimate thing to want to know. The problem is that it gets used to answer a different question — what is happening to my property — and the two get confused constantly because the same number is offered for both.
Your property does not live in the county. It lives in a district, in a price band, on a street, with a particular set of buyers who compare it to a particular set of alternatives. The distance between that reality and a countywide midpoint is where nearly every expensive misreading of this market begins. Understand the system first, and the parcel becomes legible. Start with the parcel and a headline, and you will be confidently wrong in whichever direction the mix happened to run.
If you are working through what these numbers mean for your own situation, I am glad to keep thinking alongside you.
The numbers, in text
The Santa Barbara County median sale price was $2,147,500 year to date through June 2026, while the Core median — the South Coast excluding Montecito and Hope Ranch — was $1,900,000. Current figures are published in the monthly market updates. In June 2026, the county median was $2,062,500, down 11.3 percent from May, while the average sale price was $3,667,037, up 9.6 percent, from the June SBAOR/Fidelity report. The share of June closings under $1.5 million was 25 percent, up from 13 percent in May, across all seven South Coast districts, n=95. Montecito closed 10 homes in June at a monthly median of $8,675,000, against a trailing-twelve-month median of $5,575,000. Hope Ranch closed 2 homes in June; small sample, directional only.
What is the median home price in Santa Barbara?
The Santa Barbara County median sale price is $2,147,500 year to date in 2026, but that figure blends two very different housing economies and should not be used to assess a specific property. The Core median — the South Coast excluding Montecito and Hope Ranch — is $1,900,000 year to date, roughly 11.5 percent lower. Which number applies depends entirely on where you are looking: the county figure includes north county markets that trade at a fraction of South Coast prices, and the South Coast figure is pulled upward by a small number of very large enclave sales each month. For most Santa Barbara, Goleta, and Carpinteria property, the Core median is the more accurate reference point.
Why is the Santa Barbara County median unreliable?
Because the county is not one housing market, and a median only describes the midpoint of what sold. Santa Barbara County contains a North County market and a South Coast market with very different price levels, and within the South Coast, Montecito and Hope Ranch transact at multiples of surrounding areas on small monthly counts. A shift in which of these markets happens to close in a given month moves the countywide median without any individual home changing value. The state association's own economists have publicly cautioned against relying on a countywide median for Santa Barbara for this reason. In 2026 alone, the county median fell twice for opposite reasons — once because high-end sales went quiet, once because entry-level sales surged.
What is the Core median and how is it calculated?
The Core median is the median sale price for the South Coast excluding Montecito and Hope Ranch — meaning Santa Barbara, Goleta, Carpinteria, and Summerland. It is calculated the same way any median is, simply on a market with the two highest-priced enclaves removed, and it appears directly in the Santa Barbara Association of Realtors' monthly reporting rather than being a proprietary calculation. Its purpose is to isolate the market that most South Coast property actually competes in, so that month-to-month movement reflects changes in transaction activity within that market rather than the presence or absence of a handful of enclave sales.